Site Links
Howdy, Stranger!
It looks like you're new here. If you want to get involved, click one of these buttons!
Quick Links
Categories
In this Discussion
Who's Online (1)
- DaveFred 8:57AM
Please review the site Rules, Terms of Service, and Privacy Policy at your convenience. Rules, TOS, Privacy
Get familiar with the reaction system: Introducing the Reaction System
Blender help

Seems there has been some confusion on how to use the FRD Blender Tool. I do not use it often, but I did take some time and learn it. Essentially, it does what Response Modeler does but less of it, and I think it runs quicker and uses less VBA. Anyways.
Step 1:

Click on the "HF_FRD_Data" sheet. This is not exactly super intuitive - it really should be something like "far field" or something along those lines. Anyways, it is best if you use a nice, clean measurement, properly gated.
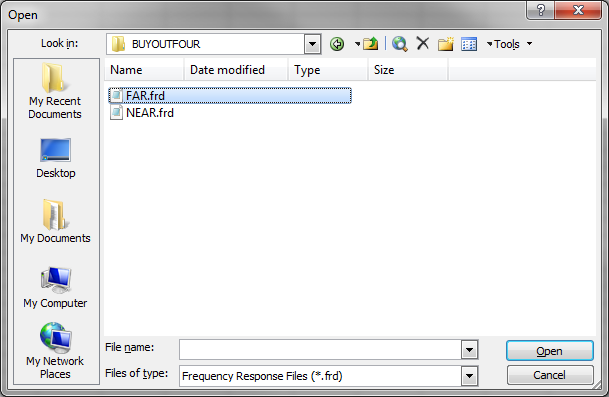
Choose your file and if it is a good file, you will be greeted with this happy little guy:
Click back on the "Control" sheet, and you should be able to view a farfield measurement:

Repeat the process, only select the "LF_FRD_Data" sheet. After, you will have something like this:
A question was raised about the tails - and I am going to offer a few thoughts on that. First, due to the nature of things - a strict 2nd or 4th order rolloff is not a guarantee.
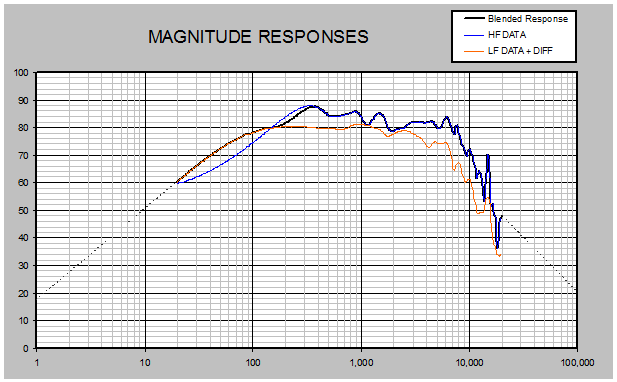
In the above, the LF tail is actually set to 10db/octave. What I do is adjust that slope until it looks like you can lay a straight edge over the simulation and the measured responses. The LF tail is easy to find.
The HF tail is a pure crapshoot, sadly. Looking at this measurement, how do we predict the required tail adjustment for this drivers behavior above 20K? Do we assume it is cresting another breakup similar to the one centered at 15k? If so, we are looking at a serious slope - and I dare you to crank that spinner in the Blender software until it shows what appears to be about 5128db/octave drop off there (mild sarcasm there). Or, does it drop off after this last measured breakup at a more relaxed rate, such as we see between 6k and 15k? That appears to be closer to 24-30db/octave.
Well, to worry about the behavior at 25kHz of a driver that will not be playing above 2500hz is (IMHO) not an efficient use of gray matter. So, pick either the very steep slope guess or the more relaxed slope guess and see what changes in your crossover simulations - I am betting it will be so close through the crossover region so as not to really matter much.
The other thing that you should be very aware of the actual modeled diffraction signature of the cabinet in question. If you know the diffraction signature, you will be able to make a better guesstimate of where to splice the two measurements. The Blender contains a diffraction simulator that appears to be lifted directly from Response Modeler. Learn to use those simulators - you will be very quickly gain insight into learning to differentiate between room, baffle, driver, and user contributions contained in the measurements.
The most important thing is learning where to splice so that baffle effects are properly accounted for and modeled/measured extension is accounted for.
Look at the baffle diffraction signature for the above:
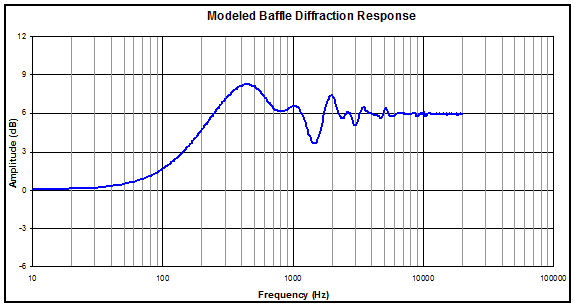
You can see where the baffle heavily influences the far field measurement - and if you draw an imaginary line straight across at the 3db graduation - where it intersects the blue simulator response is very close to the corner frequency of your baffle loss. In this case it was a 24" baffle - so the corner frequency will be very low. Why this corner frequency is not a clear field on simulators I will never understand. Anyways - still relatively ballpark but accurate enough.
So you modify your start and end frequencies to make sure post-blend you still have all of the baffle effects. The following is kind of hurried since I am pretty ready for bed, but you should get the idea.
If you are confident of your blend, click on the "Extract Minimum Phase" button, and then the "Save Blended Result to FRD File". I always cancel right away on the prompt to add notes - I am not really the kind of guy who gets excited about reading REM statements on a three column CSV/TDL file. YMMV, and the headers do offer a legitimate way to store data about the file - including measurement conditions etc.
So long story short: If it says HF_DATA it really means a gated, far or farther-field measurement.
If it says LF_DATA it really means a non-gated near field measurement or bass extension simulation.
The DIFF_FR_Data sheet is useful for viewing the diffraction signature and/or generating the above mentioned bass extension simulation.
Don't take steps that will eliminate baffle effects in your measurement.
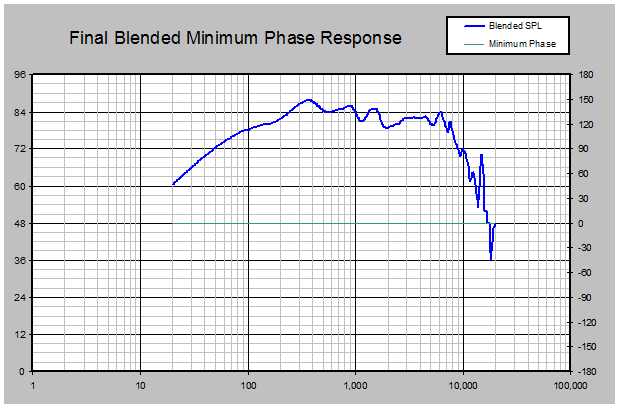
The tails are not as important as they are made out to be. The response impact will generally be pretty negigible the farther away from the crossover point the errors occur - which is why capturing good phase data closer to the crossover point is so important. If you were to squash the peak 300 and 400 Hz on the following chart, you would literally be starting with data so flawed as to render it almost useless for design work.
This is not meant to be a definitive guide, and I think we should community edit it and expand it. I am not an expert on this software. As always, have fun and stay focused on the important things - like drinking a few beers when you are stumped or parking the project and doing something else when you get ticked off.
Step 1:
Click on the "HF_FRD_Data" sheet. This is not exactly super intuitive - it really should be something like "far field" or something along those lines. Anyways, it is best if you use a nice, clean measurement, properly gated.
Choose your file and if it is a good file, you will be greeted with this happy little guy:
Click back on the "Control" sheet, and you should be able to view a farfield measurement:
Repeat the process, only select the "LF_FRD_Data" sheet. After, you will have something like this:
A question was raised about the tails - and I am going to offer a few thoughts on that. First, due to the nature of things - a strict 2nd or 4th order rolloff is not a guarantee.
In the above, the LF tail is actually set to 10db/octave. What I do is adjust that slope until it looks like you can lay a straight edge over the simulation and the measured responses. The LF tail is easy to find.
The HF tail is a pure crapshoot, sadly. Looking at this measurement, how do we predict the required tail adjustment for this drivers behavior above 20K? Do we assume it is cresting another breakup similar to the one centered at 15k? If so, we are looking at a serious slope - and I dare you to crank that spinner in the Blender software until it shows what appears to be about 5128db/octave drop off there (mild sarcasm there). Or, does it drop off after this last measured breakup at a more relaxed rate, such as we see between 6k and 15k? That appears to be closer to 24-30db/octave.
Well, to worry about the behavior at 25kHz of a driver that will not be playing above 2500hz is (IMHO) not an efficient use of gray matter. So, pick either the very steep slope guess or the more relaxed slope guess and see what changes in your crossover simulations - I am betting it will be so close through the crossover region so as not to really matter much.
The other thing that you should be very aware of the actual modeled diffraction signature of the cabinet in question. If you know the diffraction signature, you will be able to make a better guesstimate of where to splice the two measurements. The Blender contains a diffraction simulator that appears to be lifted directly from Response Modeler. Learn to use those simulators - you will be very quickly gain insight into learning to differentiate between room, baffle, driver, and user contributions contained in the measurements.
The most important thing is learning where to splice so that baffle effects are properly accounted for and modeled/measured extension is accounted for.
Look at the baffle diffraction signature for the above:
You can see where the baffle heavily influences the far field measurement - and if you draw an imaginary line straight across at the 3db graduation - where it intersects the blue simulator response is very close to the corner frequency of your baffle loss. In this case it was a 24" baffle - so the corner frequency will be very low. Why this corner frequency is not a clear field on simulators I will never understand. Anyways - still relatively ballpark but accurate enough.
So you modify your start and end frequencies to make sure post-blend you still have all of the baffle effects. The following is kind of hurried since I am pretty ready for bed, but you should get the idea.
If you are confident of your blend, click on the "Extract Minimum Phase" button, and then the "Save Blended Result to FRD File". I always cancel right away on the prompt to add notes - I am not really the kind of guy who gets excited about reading REM statements on a three column CSV/TDL file. YMMV, and the headers do offer a legitimate way to store data about the file - including measurement conditions etc.
So long story short: If it says HF_DATA it really means a gated, far or farther-field measurement.
If it says LF_DATA it really means a non-gated near field measurement or bass extension simulation.
The DIFF_FR_Data sheet is useful for viewing the diffraction signature and/or generating the above mentioned bass extension simulation.
Don't take steps that will eliminate baffle effects in your measurement.
The tails are not as important as they are made out to be. The response impact will generally be pretty negigible the farther away from the crossover point the errors occur - which is why capturing good phase data closer to the crossover point is so important. If you were to squash the peak 300 and 400 Hz on the following chart, you would literally be starting with data so flawed as to render it almost useless for design work.
This is not meant to be a definitive guide, and I think we should community edit it and expand it. I am not an expert on this software. As always, have fun and stay focused on the important things - like drinking a few beers when you are stumped or parking the project and doing something else when you get ticked off.
I have a signature.


Comments
I'm trying to put the tweeter Far field measurement in and add the tails to get rid of my spike under 100hz. The phase looks wonky like a woofer frd. I'm not certain this is correct. Sorry for the terrible screenshot but I tried the one below (400hz) and tried another tail at about 50hz. Phase looks similar for both. Does anyone have anyou advise?
See Jeff's White Paper- Accurate In-Room Frequency Response to 10 Hz...
Page 6 starts the discussion, attached
My opinion is that the one on one exchanging of files for a specific project is the easiest.
That said, I can do a piece if we can divide this up into chunks