Please review the site Rules, Terms of Service, and Privacy Policy at your convenience. Rules, TOS, Privacy
Get familiar with the reaction system: Introducing the Reaction System

Finding the Acoustic Center

I have done this multiple times, and PCD comes very close and i am able to track the woofer + tweeter FR reponse with the Tweeter and Woofer individual response in PCD. But this reading has me stumped, i am trying all sorts of distances, but nothing seems to work. The responses are not even coming closer.

The speaker is a small 2 way bookshelf, woofer below tweeter, all measurements on tweeter axis. The reading are as follows:
- Tweeter response after finding the min phase in response modeler 
- Woofer response after finding the min phase in response modeler 
- Tweeter + Woofer response after finding the min phase in response modeler 

The tweeter + woofer response was loaded as the overlay. The tweeter and woofer response and zma loaded. 
The mic distance was 36 inches, hence entered as 0.941 meters
the tweeter to woofer ctc is 5.5 inches


«13

Comments

  • Did you use Omnimic for measurements? If you did, you don't HAVE to pull min phase as omni uses time of flight. You also do not need to load the zma files. 

    You may need more on the z axis. While rare, it can be much more. On the reclamation design I did using the rs28a and w6520r, my z axis was -.043. Checked and rechecked multiple times. That's just where it was.
  • edited November 2017
    Thanks, I am using Holm impulse with a CSL calibrated umik, hence the min phase.

    I will try a larger value for the z axis - the drivers are CSS LD22C and SB15NRXC30-4
  • on another design, the woofer's z was in front of the tweeter z (by a very small amount, but it was in front). I used a tilted baffle, but the mid was a tiny 3" one.... had me very confused, till i tried a positive value.
  • The filter transfer function gives a clue. There shouldn't be any component values loaded - transfer function should be flat, but isn't.

    As a time saving measure, the impedance isn't necessary to determine relative acoustic offset.
    I'm not deaf, I'm just not listening.
  • ani_101 said:
    Thanks, I am using Holm impulse with a CSL calibrated umik, hence the min phase.

    I will try a larger value for the z axis - the drivers are CSS LD22C and SB15NRXC30-4
    HolmImpulse measures just like Omnimic as it aligns the peak of the impulse to Time = 0.  I'm assuming you have the "Data Analysis" tab set to "Detect time zero" and have selected the correct peak type.  So just gate out the reflections and import the files into PCD "as-is" after adding an offset dB (I usually add the max of 99 dB since most my Holm measurements are in the -10 to -15 dB range).  I once tried using RM to create min-phase files and couldn't get them to match either,  Hope this helps Ani.
  • I'm feeling a little dull(intoxicated), if you measure in box at same distance and power......does this include the acoustic center?
    ............. could you hum a few bars.
  • No need to extract min phase of the T+W.  The T+W has captured the time of flight differences between the drivers.

    First thing I check is flipping polarity of the tweeter the to see if something got switched accidentally.

    On Bill's coax I spent a bunch of time playing with the tails in the Blender which did make a difference
     John H, btw forum has decided I don't get emails
  • edited November 2017
    Great, thanks, i'll check this out. couple of questions:

    Ed, what should be the correct type of peak? I am attaching a screenshot of the "Data Analysis" Tab.

    John, I though that might be the issues after seeing the null, and measured twice after it and went through the steps, but no change. 

    I'll try without the impulse response, and no min phase correction.

    Kenny, the T+W contains the acoustic center offset. The T or the W doesn't. Hence trying to match the summed response in PCD of the Tweeter and Woofer to the T+W FR helps to deduce the AC.

    Decibel, there no XO component, but i seem to still get a tail on the woofer. I did reset PCD (re-initialize Program Session (including FRD and ZMA button towards the bottom), is there any other way of clearing out PCD?


  • edited November 2017
    ani_101 said:
    Decibel, there no XO component, but i seem to still get a tail on the woofer. I did reset PCD (re-initialize Program Session (including FRD and ZMA button towards the bottom), is there any other way of clearing out PCD?

    If you download a fresh spreadsheet from the internet, do you have the same issue? I seem to recall an old PETT thread where someone had a similar issue, but I don't remember the details.I wouldn't trust PCD's results if the blank sheet doesn't have flat lines.

    You could always try to replicate the result in WinPCD instead.
    I'm not deaf, I'm just not listening.
  • ani_101 said:
    Great, thanks, i'll check this out. couple of questions:

    John, I though that might be the issues after seeing the null, and measured twice after it and went through the steps, but no change. 

    Ani, you can flip the polarity with the buttons in PCD as a test
     John H, btw forum has decided I don't get emails
  • This is the closest I could get, still not very confidence inspiring...  :s


  • I wouldn't be satisfied with that in the least. The curves should match almost exactly. Can you post your 3 measurement FRD files being used?
    I'm not deaf, I'm just not listening.
  • Yes something is definitely not right Ani.  Should lay over each other almost perfectly. I'd say that isn't even close :(
  • edited November 2017
    Not a Holm user but I would get bad results in ARTA with a too long of a gate
     John H, btw forum has decided I don't get emails
  • Are you certain the level was the same for all measurements?  Usually, the higher frequencies are much higher in amplitude compared to the lower frequencies on graphs at this stage.

    Dan 
  • Same level. The sb15 is a 4 ohm woofer.

    The FRD files are in this link, this is the raw response from Holm, before taking the min phase.

    https://drive.google.com/open?id=1eSHLQeYtAwfLB1L_PIf2p_Nr5v3oavRl
  • I took a quick look at your files.  The SB15 and LD22 files look OK since their spec sheets show they have nearly the same sensitivity, but the tweeter + woofer file looks suspect.  Are you sure your amp can handle the 2 ohm load of the paralleled speakers?  It looks to me that it's having trouble handling that load.  FWIW:

    1. I use the "Largest Peak (positive/negative)" setting in Holm and check the impulse plots to verify both speaker peaks are positive (i.e. same polarity).
    2.  I use the same gate setting, just before the first reflection, for all three measurements. 
  • Ok, so there is some inconsistency with your measurements. Why does the measurement of both speakers together have a flat response on the low end that extends to 1Hz? The low end response should follow the woofer roll off. My other observation is the woofer response includes a lump around 200Hz that is not present in the response with both speakers playing. At this low frequency there just isn't any interaction of the tweeter to create this lump in the response. Simply put, no amount of offset will make these responses match. Take the measurements again.
    I'm not deaf, I'm just not listening.
  • Thanks for checking that. I didn't consider the low impedance load on the amp. I will take the measurements again for the T+W and will try a couple of amps
  • edited November 2017
    I wouldn't worry about too much about the load for a measurement where the output level is <1W.

    Gating out reflections isn't strictly necessary for determining acoustic offset, in fact I use a long gate to keep a higher measurement resolution. It is important that everything (gate, distance, level, etc) remains the same for all three measurements.
    I'm not deaf, I'm just not listening.
  • dcibel said:

    Gating out reflections isn't strictly necessary for determining acoustic offset, in fact I use a long gate to keep a higher measurement resolution. It is important that everything (gate, distance, level, etc) remains the same for all three measurements.

    I don't buy that.  Maybe if you use reflected junk in both the individual measurements and the T + M measurement.  But then you'll need to measure again as you could not trust the reflected junk individual measurements.

    The only resolution you are improving is below say 400 hz.which is easily blended in.

    I had a huge gating issue screw up my RS180P project a few years back. Opening the gate up invited junk/ dips into the higher frequencies.

     John H, btw forum has decided I don't get emails
  • edited November 2017
    dcibel said:

    Gating out reflections isn't strictly necessary for determining acoustic offset, in fact I use a long gate to keep a higher measurement resolution. It is important that everything (gate, distance, level, etc) remains the same for all three measurements.

    I don't buy that.  Maybe if you use reflected junk in both the individual measurements and the T + M measurement.  But then you'll need to measure again as you could not trust the reflected junk individual measurements.

    For determining acoustic offset it doesn't matter if the measurement contains "reflected junk". The mic isn't moving, so the reflection(s) will be present in all 3 measurements, but so what, were not measuring for frequency response. For this purpose the setup can be a lot more "willy nilly" than what you'd use for crossover design. You may still want to gate the measurement if the response is a complete mess otherwise, but I wouldn't be concerned about the first reflection, and setting up the speaker just so to get the widest gate in my room.

    For design purpose I'd be retaking the measurements anyway, as I'd want my woofer response to be an on-axis measurement, not on the tweeter axis.

    As for "resolution". the gate dictates the resolution of the measurement. When you set a gate of 4ms, 250Hz is the gate freq but is also your resolution for the first octave. Resolution doubles every octave above the gate frequency.
    I'm not deaf, I'm just not listening.
  • dcibel said:

    For design purpose I'd be retaking the measurements anyway, as I'd want my woofer response to be an on-axis measurement, not on the tweeter axis.

    I guess to each his own, but this is practice is not correct.  The modeling programs will not accurately predict the woofer off axis summed response with the tweeter.  You will know the offset but not the off axis frequency response.
     John H, btw forum has decided I don't get emails
  • Wouldn't you take the woofer far field on the tweeter axis (or the design axis, if it isn't the same as the tweeter axis) for the XO design? For near field, it would be the woofer axis.
  • Maybe my thinking isn't right since I haven't done this process in a while, I've moved to a 2 channel measurement system, but isn't the idea of inputting the woofer x and y offsets effectively adding the phase and amplitude correction to put the response at tweeter axis? This is of course with the driver size entered, which isn't being entered when determining the offset.

    I could be wrong, I haven't gone through this process in some time, with SoundEasy I simply measure each driver on axis, and the acoustic offset can be measured from the impulse response since it includes time of flight information. FWIW you could probably do the same with REW or Holm or ARTA, but have to ditch the USB mic for a 2 channel setup.

    I've successfully built a handful of speakers, so I'm confident that whatever I'm doing is working ;)
    I'm not deaf, I'm just not listening.
  • The modeling programs change the phase (time) based on the driver location so of course the combined drivers response changes.  If you look at a single driver FRD (not a summation) in PCD or XSim and decide to move the x y z, the frequency response does not change.
     John H, btw forum has decided I don't get emails
  • The modeling programs change the phase (time) based on the driver location so of course the combined drivers response changes.  If you look at a single driver FRD (not a summation) in PCD or XSim and decide to move the x y z, the frequency response does not change.
    To me this represents a problem with the modeling program. I would expect to see the response change as I move the driver along the x and y axis. If you had traced some manufacture data which is all on-axis, how do you enter it into PCD and get the correct response at the mic (tweeter) axis? I don't use Xsim, but last I looked at it I don't think it would even do an off-axis simulation, and the acoustic offset of x,y, and z were lumped into a single offset value.

    SoundEasy does this correctly in my mind. I take a driver on-axis response, and move the driver along the y-axis relative to the mic, and the response changes accordingly since the driver is both further from the mic and off-axis.

    Example, top to bottom the driver is moved further from the mic, along the y-axis.


    I'm not deaf, I'm just not listening.
  • With xsim and PCD, taking the measurements on the tweeter axis for both drivers incorporates the change in fr. Adding in the x and y axis now changes the phase response relative to the position. Making the change to the z axis is just the final step. 

    I have Soundesy but my laptop is too old to use it. Guess it's time to upgrade. 

    Xsim does not sim off axis as PCD does. Separate measurements are needed.
    dcibel
  • I had driven down to Ames to see @Ron_E a couple of weeks back. Ron helped measure and take me through the steps for designing a XO in sound easy. SouXO optimization is really cool.

    But i still haven't taken the plunge, still doing/learning the old fashioned way.... though i am guilty of taking the active shortcut from time to time....
  • After taking apart everything and setting up again, under slightly different conditions and re-measuring, I am happy to report, that I am finally getting the match that I am used to.

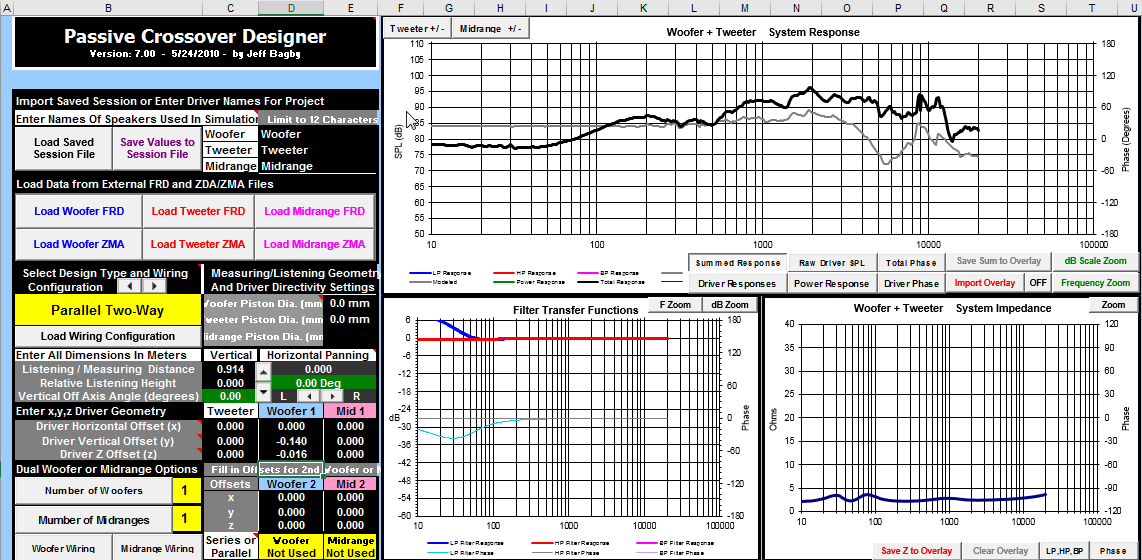
    Thanks for all the help, the FRs are now directly taken from Holm Impulse after setting it to Largest Peak (Positive / Negative). This is what it looks like... The System response is vitually indistinguishable from the Overlay. The Z also turned out to be quite large at 0.067.


    jhollander
Sign In or Register to comment.